
Sentiment Analysis: Turning Emotions into Insight
Our text mining capability has been extended from extracting insights from vast data, to extracting sentiment and emotions.
Text mining Twitter often involves entity extraction and pattern matching processes, where relevant information is extracted from tweets to highlight patterns of consumer behaviour or shared opinions.
At Text Mining Solutions we have taken this analysis one step further with the introduction of Sentiment Analysis. We don’t just identify relevant content but extract the overall sentiment of the posts as well.
The process identifies and categorises opinions expressed in tweets, from the vocabulary used to any emojis included, in order to determine whether the overall feeling towards a brand is positive, negative or neutral. We can then delve deeper into this underlying data by looking into the clusters to see what the actual comments were concerned with.
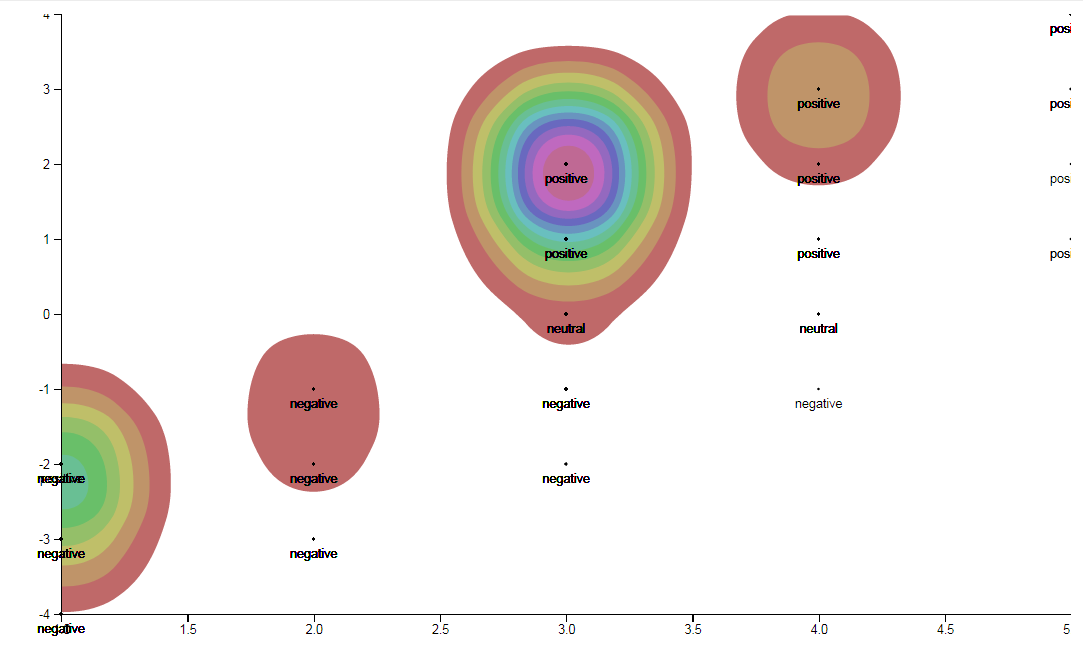
If we take a look at the following heat maps, we can see how Twitter users felt towards electric car manufacturers BMW and Hyundai.
The x-axis shows the positive sentiment ranging from 0 to +5. The y-axis is the sentiment score, that is to say, in a mixed sentiment tweet, the positive score minus the negative score. Therefore, the further towards the top right-hand side the circle is, the better.
Of course, one would like to see all the heat (deep colours) towards the top right-hand side of the chart, meaning Twitter posts primarily show a positive interest in the topic. Darker colours seen towards the bottom left-hand side are highly critical, meaning there is a great deal of negativity towards the brand. In reality, brands cannot necessarily please their entire audience, therefore it is ideal to have predominance towards the top right.
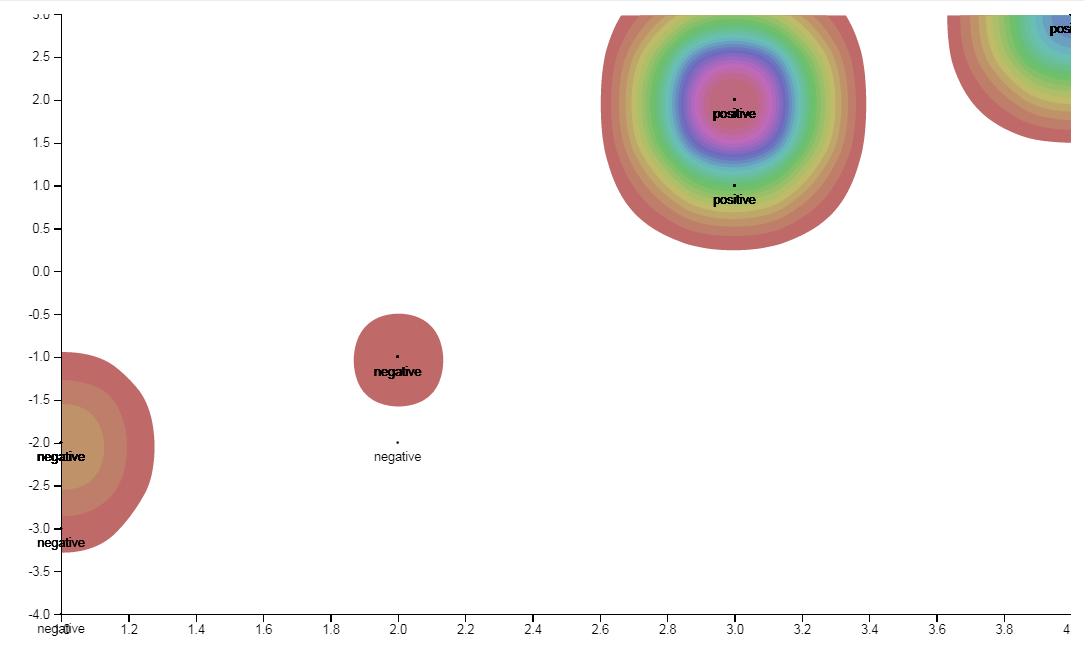
The Hyundai chart is rather positive which we can see due to the position of the cluster towards the right-hand side of the graph and its depth of colours. This can be explained by the great positive response to recent marketing campaigns after the manufacturer debuted the new Hyundai Kona, Tuscan and IONIQ last week. Twitter users were quick to express their enthusiasm of Korean boy band, BTS, providing a song for the advertisement campaign. Due to this successful collaboration with BTS, Hyundai received heaps of positive tweets by association which is visible on the heat map.
However, the BMW heat map tells a very different story. After announcing that the Oxford BMW Mini car plant was set for hundreds of job losses many took to Twitter to share the news and vent their frustrations. Another area of complaint for BMW was due to the dislike of the brand’s grill…
“@BMW the obnoxious grills on the new cars aren’t cute”
“@BMW shud stop destroying their grill design. The way they are screwing their signature kidney grill is not at all pleasing to the eyes.”
“@BMW Please stop with that hideously massive grill. Surely you all are seeing the outrage on each Tweet you all post with that ugly grill.”
Although a minor element of the vehicles’ construction, shared opinions disliking the new BMW grill alongside the redundancies has flooded the heat map as we see the deep cluster of negative sentiment towards the bottom left-hand corner.
Nevertheless, within the same week an old school 1980 BMW R100RS was commissioned and modified by Dirk Oehlerking which caused a stir of excitement on Twitter. Tweets strongly supported the luxury museum-worthy model which can be seen by the deep clusters of positive sentiment by the top right corner of the graph.
At Text Mining Solutions we can tailor software to identify key sentiment throughout any industry with any brand. By social media giving a voice and power to consumers, it is essential to understand what they are saying about your brand and what impression they are sharing to their followers.