
Symptom Tracking COVID-19 through text mining
Text Mining Solutions is joining the effort to find a way to efficiently and effectively track the spread of Covid-19, in the hope of helping the UK come out of lockdown safely and provide early warnings of hotspots which may flare-up.
As many of you will know, the NHS Covid-19 Tracing app has been launched on the Isle of Wight. Using Bluetooth, the app will record who users are meeting with, which will make it easier to trace and notify people if someone with whom they have been in contact with contracts the virus. It is hoped that with a large percentage of the population using the app, alongside other measures, the number of new coronavirus cases could be substantially reduced. This new technology is at the heart of the government’s strategy as we begin to come out of coronavirus lockdown, with a huge focus on the monitoring, testing and tracing of the virus.
However, the NHS app is based on what is called a “centralised” model. This means that data is held by the NHS in a single database, which has posed concerns in terms of privacy and security. Alongside the Tracing app, a similar initiative has been developed by King’s College London, which already has more than 2.4million users. The COVID Symptom Study app uses a different method and instead encourages users to self-report coronavirus symptoms. Both of these technologies are working to find a way to map the spread of the virus so that affected areas can be recorded, and potentially infected people can be informed.
Text Mining Solutions has developed a new method to achieve similar results and generate a map of who is infected and where by collecting and processing tweets. So far, TMS has collected 10M tweets and is currently gathering nearly 1million per day, allowing us to monitor social media for individuals reporting symptoms and their location.
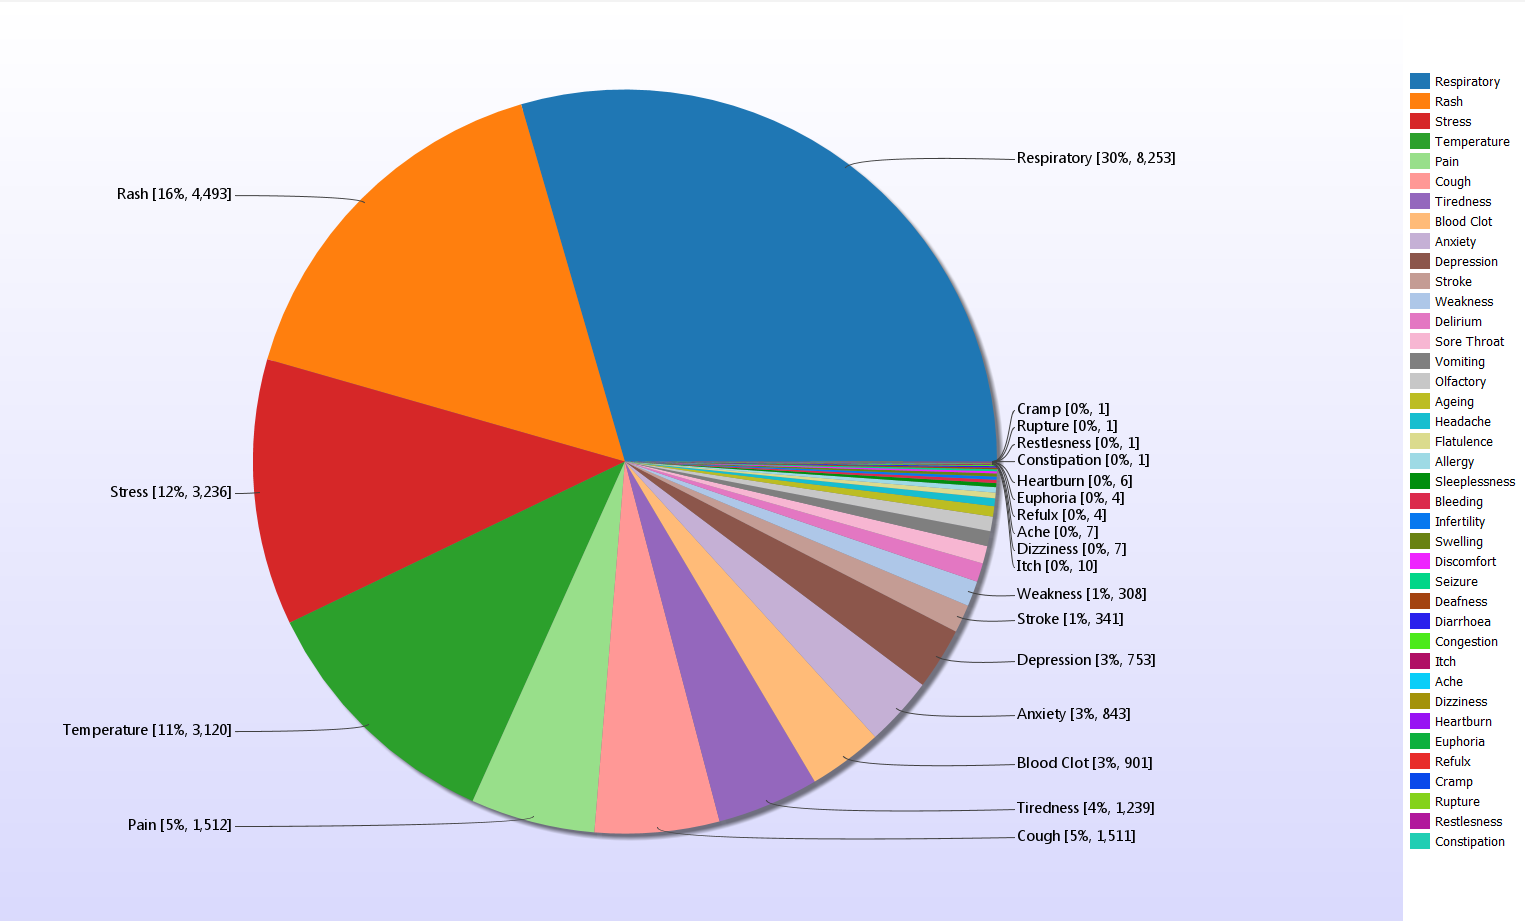
The charts below present our results so far, after having text mined Twitter for just under a week.
The chart below shows more basically the range of symptoms that people are experiencing, which in addition to tracking the virus’ spread, is also providing new data about the disease. New symptoms continue to come to light which is not being reflected in other statistics, and by tracking Covid-19 in this way we are able to monitor the different ways that the virus is presenting itself. By tracking “weak signals”, we are able to monitor symptoms that might otherwise get overlooked but will be very important in directing resources to new outbreaks or treating patients with new symptoms.
Interestingly, we can see that ‘rash’ is a large segment, likely with ‘COVID toes’ being a relatively new symptom accounting for a sudden increase in tweets. Capturing moments like this along the greater timeline of coronavirus allows us to collect invaluable data about the disease.
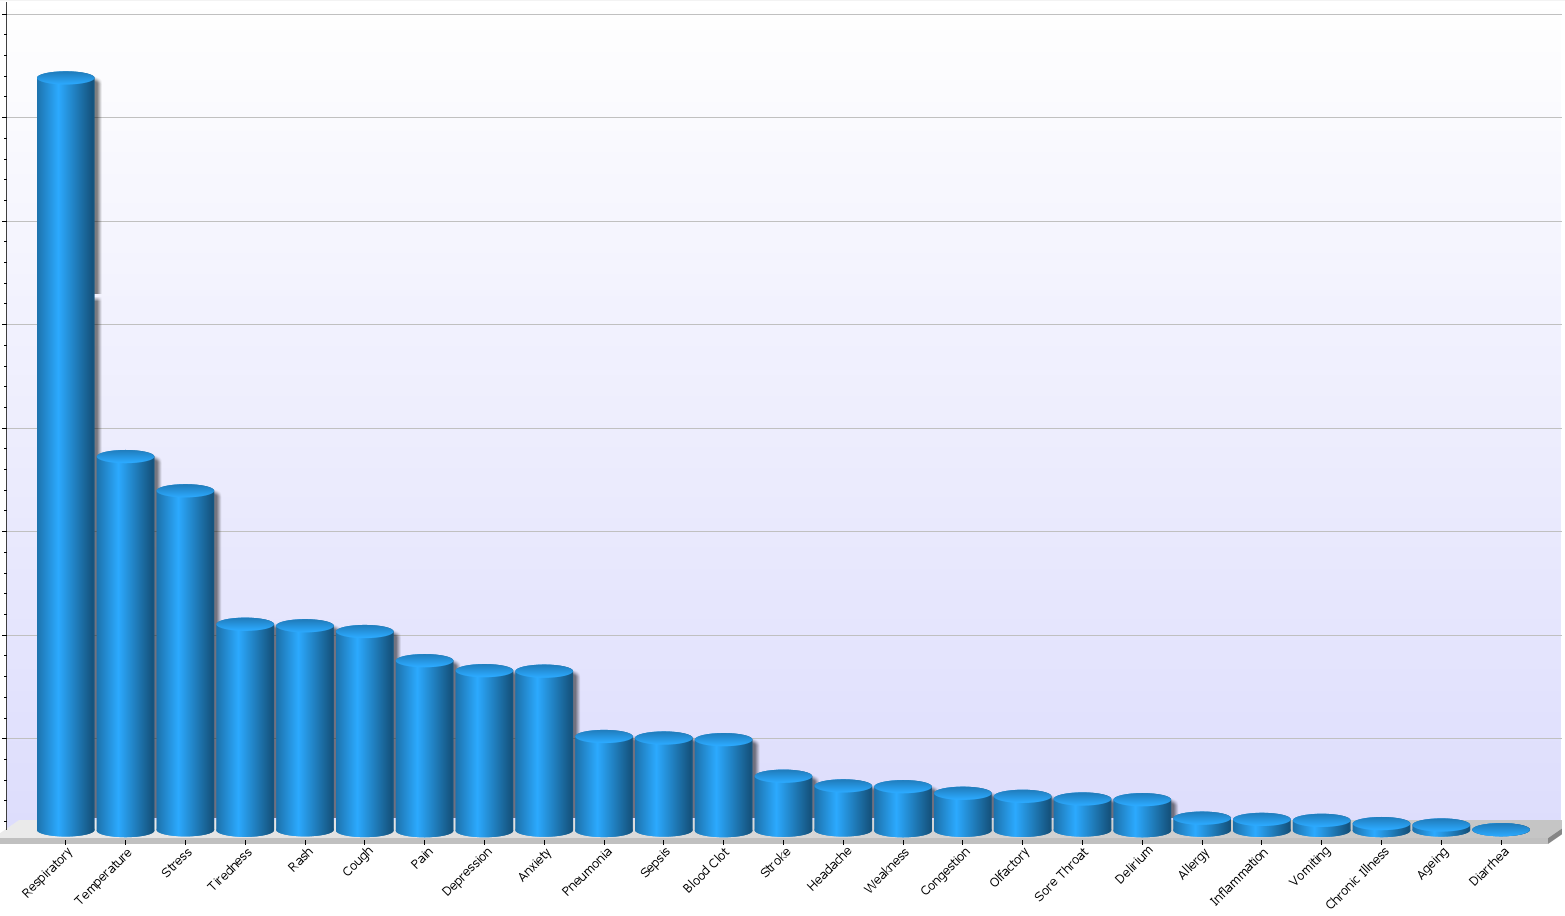
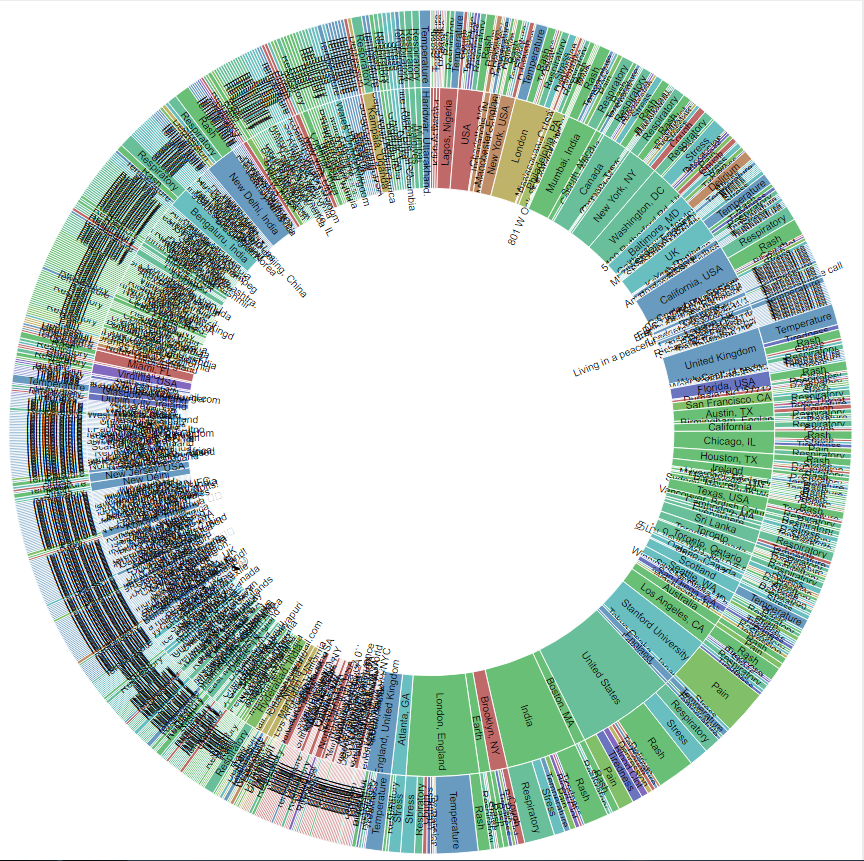
To the right, the bar graph shows the reported symptoms worldwide, excluding the general expression of feeling ill. Alongside this, the coloured wheel presents these symptoms by location, demonstrating geo-tracking, Although it might look quite busy, it shows the number of records processed and can be zoomed into on a granular level, allowing us to look at individual counties or cities!
Using text mining in this way will assist the monitoring of the virus, in terms of both its nature and the spread of it.